7 Star 23 Fork 6

HDB-Li / LLDebugTool

加入 Gitee
与超过 1200万 开发者一起发现、参与优秀开源项目,私有仓库也完全免费 :)
免费加入
克隆/下载
贡献代码
同步代码
取消
提示: 由于 Git 不支持空文件夾,创建文件夹后会生成空的 .keep 文件
Loading...
README
MIT

 LLDebugTool

Version CocoaPods Compatible Carthage Compatible Platform License Language Twitter

简介

Click here for an English introduction

LLDebugTool是一款针对开发者和测试者的调试工具,它可以帮助你在非Xcode的情况下,进行数据分析和操作。

LLDebugToolSwift是针对LLDebugTool的Swift扩展,它提供了LLDebugTool的Swift接口,LLDebugToolSwift会和LLDebugTool同步更新。

如果你的项目是一个Objective-C项目,你可以使用LLDebugTool,如果你的项目是一个Swift项目或者包含Swift文件,你可以使用LLDebugToolSwift

为您的下一个项目选择LLDebugTool,或者迁移到您现有的项目中——您会为此感到惊喜!🎊🎊🎊
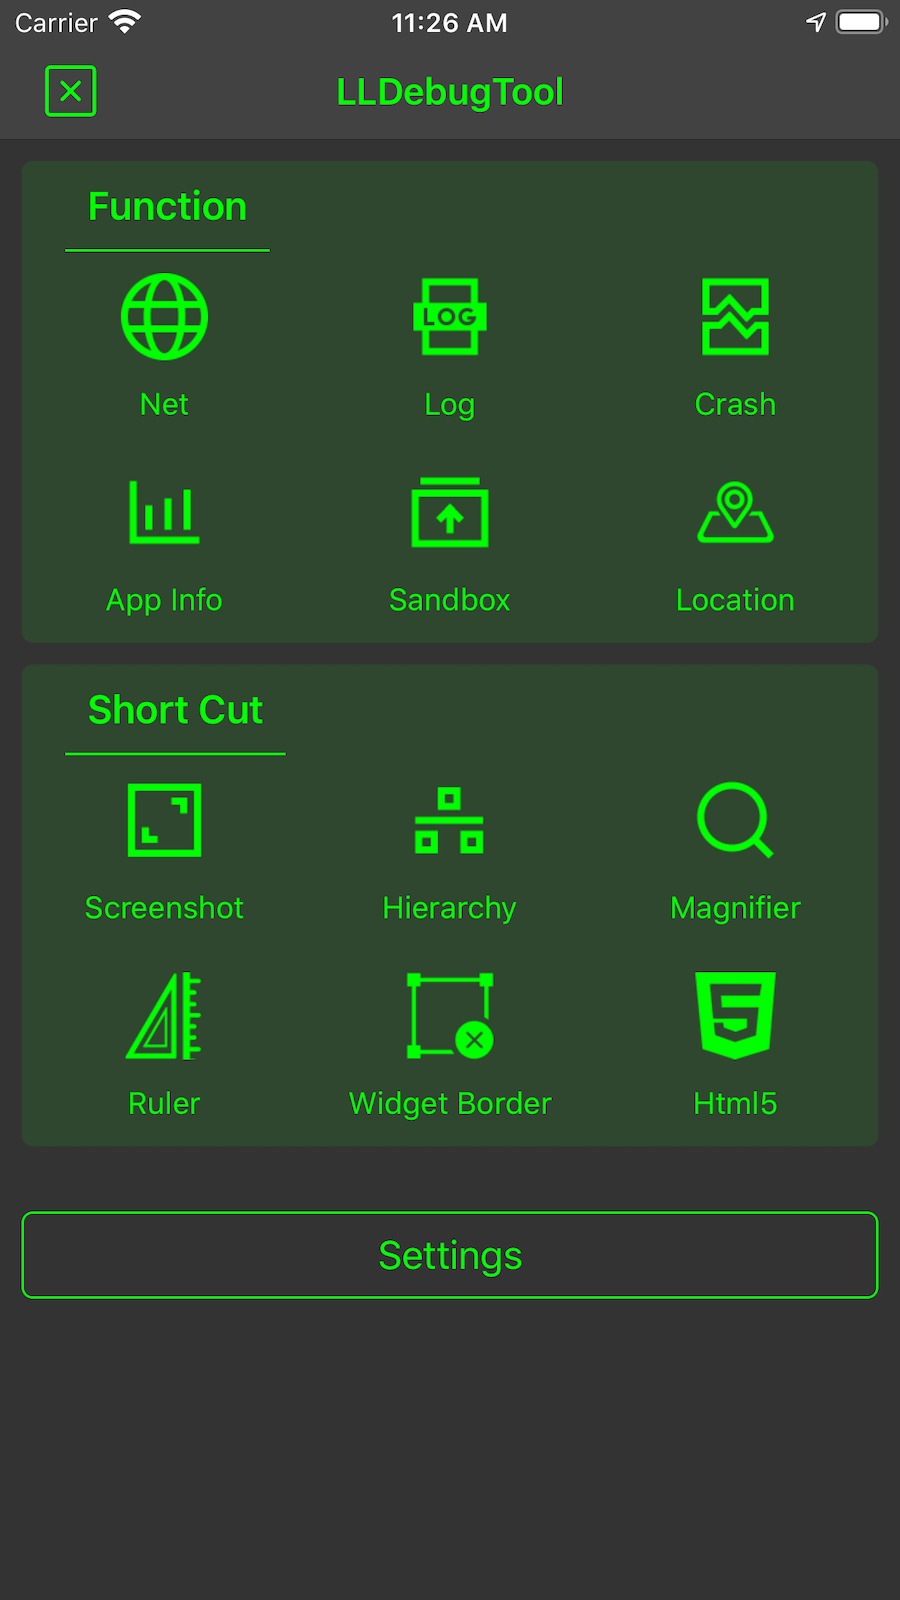
Gif

预览

最近更新 (1.3.7)

模拟定位 功能和组件化。

  • 拆分成组件后,你可以只通过 LLDebugTool/{subspec} 去集成某些组件,例如 LLDebugTool/NetworkLLDebugToolLog
  • 新的 模拟定位 功能,现在你可以在任何时候模拟到任何地点。支持CLLocationManagerMKMapView
  • 支持Podfile中的 generate_multiple_pod_projects

我能用LLDebugTool做什么?

  • 检查网络请求或者查看某些事件的日志信息,而不必非在XCode运行下运行。这在解决测试人员的问题上很有用。

  • 更轻松的筛选有用的信息。

  • 更轻松的处理偶发的问题。

  • 更轻松的分析崩溃原因。

  • 更轻松的分享、预览或删除沙盒文件,这在开发阶段非常有用。

  • 更轻松的观察App的CPU,内存,FPS等信息。

  • 截屏、标注并分享。

  • 更直观的查看视图结构,并修改具体属性值。

  • 更准确地确定App里的UI元素和颜色。

  • 便捷的获取和对比位置信息。

  • 便捷的查看元素边框及位置。

  • 快速的Html容器入口。

  • 模拟定位。

添加 LLDebugTool 到你的项目中

CocoaPods

CocoaPods 是集成LLDebugTool的首选方式。

Objective - C
  1. 添加 pod 'LLDebugTool' , '~> 1.0' 到你的Podfile里。
  2. 如果只想在Debug模式下使用,则添加pod 'LLDebugTool' , '~> 1.0' ,:configurations => ['Debug'] 到你的Podfile里,详细的配置方式可以查看Wiki/如何仅在Debug环境中使用。如果你想要指定某个版本,可以类似这样使用 pod 'LLDebugTool' , '1.3.7' ,:configurations => ['Debug']
  3. 推荐的方式是采用多Target来处理,只在Debug Target中添加pod 'LLDebugTool' , '~> 1.0',这样做的好处既不污染Product环境的代码,又可以在Archive Debug环境的App时,将LLDebugTool集成进去(如果采用:configurations => ['Debug']的方式,只能通过XCode运行,不可以Archive成App)。
  4. 终端输入pod install来进行集成。搜索不到LLDebugTool或者搜不到最新版本时,可先运行pod repo update,再执行pod install
  5. 在你需要使用LLDebugTool的文件里添加#import "LLDebug.h",或者直接在pch文件中添加#import "LLDebug.h"
Swift
  1. 添加 pod 'LLDebugToolSwift' , '~> 1.0' 到你的Podfile里。
  2. 如果只想在Debug模式下使用,则添加pod 'LLDebugToolSwift' , '~> 1.0' ,:configurations => ['Debug'] 到你的Podfile里,详细的配置方式可以查看Wiki/如何仅在Debug环境中使用。如果你想要指定某个版本,可以类似这样使用 pod 'LLDebugToolSwift' , '1.3.7' ,:configurations => ['Debug']
  3. 推荐的方式是采用多Target来处理,只在Debug Target中添加pod 'LLDebugToolSwift' , '~> 1.0',这样做的好处既不污染Product环境的代码,又可以在Archive Debug环境的App时,将LLDebugToolSwift集成进去(如果采用:configurations => ['Debug']的方式,只能通过XCode运行,不可以Archive成App)。
  4. 必须在Podfile中添加 use_frameworks!
  5. 终端输入pod install来进行集成。搜索不到LLDebugToolSwift或者搜不到最新版本时,可先运行pod repo update,再执行pod install
  6. 在你需要使用LLDebugTool的文件里添加import LLDebugToolSwift

Carthage

Carthage 是一个分散的依赖管理器,它构建您的依赖并为您提供framework框架。

Objective - C
  1. 要使用Carthage将LLDebugTool集成到Xcode项目中,请在Cartfile中指定它:

    github "LLDebugTool"

  2. 运行 carthage 来构建框架,并将构建的LLDebugTool.framework拖到Xcode项目中。

Swift
  1. 要使用Carthage将LLDebugToolSwift集成到Xcode项目中,请在Cartfile中指定它:

    github "LLDebugToolSwift"

  2. 运行 carthage 来构建框架,并将构建的LLDebugToolSwift.framework拖到Xcode项目中。

源文件

您可以直接将名为LLDebugTool文件夹的源文件添加到项目中。

Objective - C
  1. 下载最新的代码版本或将存储库作为git子模块添加到您的git跟踪项目中。
  2. 在Xcode中打开项目,然后拖拽名为“LLDebugTool”的源文件夹到你的项目中。当提示Choose options for adding these files时,务必勾选Copy items if needed这项。
  3. 集成FMDB到项目中,FMDB是一个围绕SQLite的Objective-C包装器开源库。
  4. 集成Masonry到项目中,Masonry是一个约束库。
  5. 在你需要使用LLDebugTool的文件里添加#import "LLDebug.h",或者直接在pch文件中添加#import "LLDebug.h"
Swift
  1. 下载最新的Objective-C代码版本或将存储库作为git子模块添加到您的git跟踪项目中。
  2. 下载最新的Swift扩展代码版本或将存储库作为git子模块添加到您的git跟踪项目中。
  3. 在Xcode中打开项目,然后拖拽名为“LLDebugTool”和“LLDebugToolSwift”的源文件夹到你的项目中。当提示Choose options for adding these files时,务必勾选Copy items if needed这项。
  4. 集成FMDB到项目中,FMDB是一个围绕SQLite的Objective-C包装器开源库。
  5. 集成Masonry到项目中,Masonry是一个约束库。
  6. 在你需要使用LLDebugTool的文件里添加import LLDebugToolSwift

如何使用

启动

你需要在"application:(UIApplication * )application didFinishLaunchingWithOptions:(NSDictionary * )launchOptions"中启动LLDebugTool,否则你可能会丢掉某些信息。

如果你想自定义一些参数,你需要在调用"startWorking"前配置这些参数。更详细的配置信息请看LLConfig.h

  • 快速启动

In Objective-C

#import "AppDelegate.h"
#import "LLDebug.h"

- (BOOL)application:(UIApplication *)application didFinishLaunchingWithOptions:(NSDictionary *)launchOptions {
    // The default color configuration is green background and white text color. 

    // Start working.
    [[LLDebugTool sharedTool] startWorking];
    
    // Write your project code here.
    return YES;
}

In Swift

import LLDebugToolSwift

    func application(_ application: UIApplication, didFinishLaunchingWithOptions launchOptions: [UIApplicationLaunchOptionsKey: Any]?) -> Bool {
        // ####################### Start LLDebugTool #######################//
        // Use this line to start working.
        LLDebugTool.shared().startWorking()
        
        // Write your project code here.
        
        return true
    }
  • 使用自定义的配置启动

In Objective-C

#import "AppDelegate.h"
#import "LLDebug.h"

- (BOOL)application:(UIApplication *)application didFinishLaunchingWithOptions:(NSDictionary *)launchOptions {

    // Start working with config.
    [[LLDebugTool sharedTool] startWorkingWithConfigBlock:^(LLConfig * _Nonnull config) {

        //####################### Color Style #######################//
        // Uncomment one of the following lines to change the color configuration.
        // config.colorStyle = LLConfigColorStyleSystem;
        // [config configBackgroundColor:[UIColor orangeColor] primaryColor:[UIColor whiteColor] statusBarStyle:UIStatusBarStyleDefault];

        //####################### User Identity #######################//
        // Use this line to tag user. More config please see "LLConfig.h".
        config.userIdentity = @"Miss L";

        //####################### Window Style #######################//
        // Uncomment one of the following lines to change the window style.
        // config.entryWindowStyle = LLConfigEntryWindowStyleNetBar;

    }];
    
    return YES;
}

In Swift

import LLDebugToolSwift

    func application(_ application: UIApplication, didFinishLaunchingWithOptions launchOptions: [UIApplicationLaunchOptionsKey: Any]?) -> Bool {
        
        // Start working with config.
        LLDebugTool.shared().startWorking { (config) in
            //####################### Color Style #######################//
            // Uncomment one of the following lines to change the color configuration.
            // config.colorStyle = .system
            // config.configBackgroundColor(.orange, textColor: .white, statusBarStyle: .default)
        
            //####################### User Identity #######################//
            // Use this line to tag user. More config please see "LLConfig.h".
            config.userIdentity = "Miss L";
        
            //####################### Window Style #######################//
            // Uncomment one of the following lines to change the window style.
            // config.windowStyle = .netBar
        
            //####################### Features #######################//
            // Uncomment this line to change the available features.
            // config.availables = .noneAppInfo
        }
        
        return true
    }

网络请求

你不需要做任何操作,只需要调用了"startWorking"就可以监控大部分的网络请求,包括使用NSURLSession,NSURLConnection和AFNetworking。如果你发现某些情况下无法监控网络请求,请打开一个issue来告诉我。

日志

打印和保存一个日志。 更多的log宏信息查看LLDebugToolMacros.h

  • 保存日志

In Objective-C

#import "LLDebug.h"

- (void)testNormalLog {
    // Insert an LLog where you want to print.
    LLog(@"Message you want to save or print.");
}

In Swift

import LLDebugToolSwift

    func testNormalLog() {
        // Insert an LLog where you want to print.
        LLog.log(message: "Message you want to save or print.")
    }
  • Save Log with event and level

In Objective-C

#import "LLDebug.h"

- (void)testEventErrorLog {
    // Insert an LLog_Error_Event where you want to print an event and level log.
    LLog_Error_Event(@"The event that you want to mark. such as bugA, taskB or processC.",@"Message you want to save or print.");
}

In Swift

import LLDebugToolSwift

    func testEventErrorLog() {
        // Insert an LLog_Error_Event where you want to print an event and level log.
        LLog.errorLog(message: "Message you want to save or print.", event: "The event that you want to mark. such as bugA, taskB or processC.")
    }

崩溃

你不需要做任何操作,只需要调用"startWorking"就可以截获崩溃,保存崩溃信息、原因和堆栈信息,并且也会同时保存当次网络请求和日志信息。

App信息

LLDebugTool会监控app的CPU,内存和FPS。你可以更便捷的查看app的各种信息。

沙盒

LLDebugTool提供了一个快捷的方式来查看和操作沙盒文件,你可以更轻松的删除沙盒中的文件/文件夹,或者通过airdrop来分享文件/文件夹。只要是apple支持的文件格式,你可以直接通过LLDebugTool来预览。

截屏

LLDebugTool提供了一个截屏功能,并且可以进行简单的绘画和标注,用于测试或者美工调试App时方便记录。

视图结构

LLDebugTool提供了一个视图结构工具,用于在非Debug模式下查看或者修改元素的属性和信息。

放大镜

LLDebugTool提供了一个放大镜的工具,用于放大局部UI和查看指定位置的颜色值。

格尺

LLDebugTool提供了一个格尺工具,用于便捷的获取和对比位置信息。

元素边框

LLDebugTool提供了一个元素边框工具,便捷的查看元素边框及位置。

HTML

LLDebugTool可以在你的app中随时调试通过 WKWebViewUIWebView 或者你自定义的ViewController来调试html页面。

定位

LLDebugTool可以随时在你的app中模拟定位信息,支持 CLLocationManagerMKMapView

更多使用

  • 你可以通过查看Wiki,获得更多帮助。
  • 你可以下载并运行LLDebugToolDemoLLDebugToolSwiftDemo来发现LLDebugTool的更多使用方式。Demo是在MacOS 10.15.1,XCode 11.2.1,iOS 13.2.2,CocoaPods 1.8.4下运行的,如果有任何版本兼容问题,请告诉我。

要求

LLDebugTool在支持ios8+,并且需要使用ARC模式。使用到的框架已经包含在大多数Xcode模板中:

  • UIKit

  • Foundation

  • SystemConfiguration

  • Photos

  • QuickLook

  • CoreTelephony

  • CoreLocation

  • MapKit

结构

  • LLDebug.h

    公用头文件。全局引用此文件即可。

  • DebugTool

    LLDebugTool.h 用于启动和停止LLDebugTool,你需要看一下这个文件。

    LLConfig.h 用于自定义颜色、大小、标识和其他信息。如果您想要配置任何东西,您需要关注这个文件。

    LLDebugToolMacros.h 快捷的宏定义文件。

  • Component

    • Network 用于监视网络请求。
    • Log 快速打印和保存日志。
    • Crash 用于当App发生崩溃时,收集崩溃信息。
    • AppInfo 用于监视应用程序的各种属性。
    • Sandbox 用于查看和操作沙盒文件。
    • Screenshot 用于处理和展示截屏事件。
    • Hierarchy 用于处理和展示视图结构。
    • Magnifier 用于放大镜功能。
    • Ruler 用于格尺功能。
    • Widget Border 用于元素边框功能。
    • Html 用于动态调试Web界面。
    • Location 用于模拟定位功能。
    • Function 用于展示功能列表。
    • Setting 用于动态修改配置。

联系

  • 如果你需要帮助,打开一个issue。
  • 如果你想问一个普遍的问题,打开一个issue。
  • 如果你发现了一个bug并能提供可靠的复制步骤,打开一个issue。
  • 如果你有一个功能请求,打开一个issue。
  • 如果你发现有什么不对或不喜欢的地方,就打开一个issue。
  • 如果你有一些好主意或者一些需求,请发邮件(llworkinggroup1992@gmail.com)给我。
  • 如果你想贡献,提交一个pull request。

联系

更新日志

可以在 CHANGELOG 中找到每个LLDebugTool版本的简要总结。

许可

这段代码是根据 MIT license 的条款和条件发布的。

<p align="center" > <img src="https://raw.githubusercontent.com/HDB-Li/HDBImageRepository/master/LLDebugTool/header.png" alt="LLDebugTool" title="LLDebugTool"> </p> [![Version](https://img.shields.io/badge/iOS-%3E%3D8.0-f07e48.svg)](https://img.shields.io/badge/iOS-%3E%3D8.0-f07e48.svg) [![CocoaPods Compatible](https://img.shields.io/badge/pod-v1.3.7-blue.svg)](https://img.shields.io/badge/pod-v1.3.7-blue.svg) [![Carthage Compatible](https://img.shields.io/badge/Carthage-compatible-4BC51D.svg?style=flat)](https://github.com/Carthage/Carthage) [![Platform](https://img.shields.io/badge/Platform-iOS-lightgrey.svg)](https://img.shields.io/badge/Platform-iOS-lightgrey.svg) [![License](https://img.shields.io/badge/License-Anti%20996-blue.svg)](https://github.com/996icu/996.ICU/blob/master/LICENSE) [![Language](https://img.shields.io/badge/Language-Objective--C%20%7C%20Swift-yellow.svg)](https://img.shields.io/badge/Language-Objective--C%20%7C%20Swift-yellow.svg) [![Twitter](https://img.shields.io/badge/Twitter-@HdbLi-1DA1F2.svg)](https://twitter.com/HdbLi) ## Introduction [点击查看中文简介](https://github.com/HDB-Li/LLDebugTool/blob/master/README-cn.md) LLDebugTool is a debugging tool for developers and testers that can help you analyze and manipulate data in non-xcode situations. [LLDebugToolSwift](https://github.com/HDB-Li/LLDebugToolSwift) is the extension of [LLDebugTool](https://github.com/HDB-Li/LLDebugTool), it provide swift interface for LLDebugTool, LLDebugToolSwift will release with LLDebugTool at same time. If your project is a Objective-C project, you can use `LLDebugTool`, if your project is a Swift project or contains swift files, you can use `LLDebugToolSwift`. Choose LLDebugTool for your next project, or migrate over your existing projects—you'll be happy you did! 🎊🎊🎊 #### Gif <div align="left"> <img src="https://raw.githubusercontent.com/HDB-Li/HDBImageRepository/master/LLDebugTool/screenGif.gif" width="18%"></img> <img src="https://raw.githubusercontent.com/HDB-Li/HDBImageRepository/master/LLDebugTool/ScreenGif-Screenshot.gif" width="18%"></img> <img src="https://raw.githubusercontent.com/HDB-Li/HDBImageRepository/master/LLDebugTool/ScreenGif-Screenshot2.gif" width="18%"></img> <img src="https://raw.githubusercontent.com/HDB-Li/HDBImageRepository/master/LLDebugTool/ScreenGif-Screenshot3.gif" width="18%"></img> <img src="https://raw.githubusercontent.com/HDB-Li/HDBImageRepository/master/LLDebugTool/ScreenGif-Screenshot4.gif" width="18%"></img> </div> #### Preview <div align="left"> <img src="https://raw.githubusercontent.com/HDB-Li/HDBImageRepository/master/LLDebugTool/ScreenShot-3.png" width="18%"> </img> </div> ## What's new in 1.3.7 <img src="https://raw.githubusercontent.com/HDB-Li/HDBImageRepository/master/LLDebugTool/ScreenGif-Screenshot4.gif" width="20%"></img> ### `Mock Location` function and split into components. * Split into components, you can now integrate only a few components by `LLDebugTool/{subspec}`, such as `LLDebugTool/Network`、`LLDebugTool/Log`. * New `Mock Location` function, now you can mock location to anywhere at anytime. Support `CLLocationManager` and `MKMapView`. * Support `generate_multiple_pod_projects` in podfile. ## What can you do with LLDebugTool? - Always check the network request or view log information for certain events without having to run under XCode. This is useful in solving the testers' problems. - Easier filtering and filtering of useful information. - Easier analysis of occasional problems. - Easier analysis of the cause of the crash. - Easier sharing, previewing, or removing sandbox files, which can be very useful in the development stage. - Easier observe app's memory, CPU, FPS and other information. - Take screenshots, tag and share. - More intuitive view of view structure and dynamic modify properties. - Determine UI elements and colors in your App more accurately. - Easy access to and comparison of point information. - Easy access to element borders and frames. - Quick entry for html. - Mock location at anytime. ## Adding LLDebugTool to your project ### CocoaPods [CocoaPods](http://cocoapods.org) is the recommended way to add `LLDebugTool` to your project. ##### Objective - C > 1. Add a pod entry for LLDebugTool to your Podfile `pod 'LLDebugTool' , '~> 1.0'`. > 2. If only you want to use it only in Debug mode, Add a pod entry for LLDebugTool to your Podfile `pod 'LLDebugTool' , '~> 1.0' ,:configurations => ['Debug']`, Details also see [Wiki/Use in Debug environment](https://github.com/HDB-Li/LLDebugTool/wiki/Use-in-Debug-environment). If you want to specify the version, use as `pod 'LLDebugTool' , '1.3.7' ,:configurations => ['Debug']`. > 3. The recommended approach is to use multiple targets and only add `pod 'LLDebugTool', '~> 1.0'` to Debug Target. This has the advantage of not contamiling the code in the Product environment and can be integrated into the App in the Archive Debug environment (if `:configurations => ['Debug']`, it can only run through XCode. It is not possible to Archive as an App). > 4. Install the pod(s) by running `pod install`. If you can't search `LLDebugTool` or you can't find the newest release version, running `pod repo update` before `pod install`. > 5. Include LLDebugTool wherever you need it with `#import "LLDebug.h"` or you can write `#import "LLDebug.h"` in your .pch in your .pch file. ##### Swift > 1. Add a pod entry for LLDebugToolSwift to your Podfile `pod 'LLDebugToolSwift' , '~> 1.0'`. > 2. If only you want to use it only in Debug mode, Add a pod entry for LLDebugToolSwift to your Podfile `pod 'LLDebugToolSwift' , '~> 1.0' ,:configurations => ['Debug']`, Details also see [Wiki/Use in Debug environment](https://github.com/HDB-Li/LLDebugTool/wiki/Use-in-Debug-environment). If you want to specify the version, use as `pod 'LLDebugToolSwift' , '1.3.7' ,:configurations => ['Debug']`. > 3. The recommended approach is to use multiple targets and only add `pod 'LLDebugToolSwift', '~> 1.0'` to Debug Target. This has the advantage of not contamiling the code in the Product environment and can be integrated into the App in the Archive Debug environment (if `:configurations => ['Debug']`, it can only run through XCode. It is not possible to Archive as an App). > 4. Must be added in the Podfile **`use_frameworks!`**. > 5. Install the pod(s) by running `pod install`. If you can't search `LLDebugToolSwift` or you can't find the newest release version, running `pod repo update` before `pod install`. > 6. Include LLDebugTool wherever you need it with `import "LLDebugToolSwift`. ### Carthage [Carthage](https://github.com/Carthage/Carthage) is a decentralized dependency manager that builds your dependencies and provides you with binary frameworks. ##### Objective - C > 1. To integrate LLDebugTool into your Xcode project using Carthage, specify it in your `Cartfile`: > > `github "LLDebugTool"` > > 2. Run `carthage` to build the framework and drag the built `LLDebugTool.framework` into your Xcode project. ##### Swift > 1. To integrate LLDebugToolSwift into your Xcode project using Carthage, specify it in your `Cartfile`: > > `github "LLDebugToolSwift"` > > 2. Run `carthage` to build the framework and drag the built `LLDebugToolSwift.framework` into your Xcode project. ### Source files Alternatively you can directly add the source folder named LLDebugTool. to your project. ##### Objective - C > 1. Download the [latest code version](https://github.com/HDB-Li/LLDebugTool/archive/master.zip) or add the repository as a git submodule to your git-tracked project. > 2. Open your project in Xcode, then drag and drop the source folder named `LLDebugTool`. When you are prompted to "Choose options for adding these files", be sure to check the "Copy items if needed". > 3. Integrated [FMDB](https://github.com/ccgus/fmdb) to your project,FMDB is an Objective-C wrapper around SQLite. > 4. Integrated [Masonry](https://github.com/SnapKit/Masonry) to your project, Masonry is an Objective-C constraint library. There are no specific version requirements, but it is recommended that you use the latest version. > 5. Include LLDebugTool wherever you need it with `#import "LLDebug.h"` or you can write `#import "LLDebug.h"` in your .pch in your .pch file. ##### Swift > 1. Download the [LLDebugTool latest code version](https://github.com/HDB-Li/LLDebugTool/archive/master.zip) or add the repository as a git submodule to your git-tracked project. > 2. Download the [LLDebugToolSwift latest code version](https://github.com/HDB-Li/LLDebugToolSwift/archive/master.zip) or add the repository as a git submodule to your git-tracked project. > 3. Open your project in Xcode, then drag and drop the source folder named `LLDebugTool` and `LLDebugToolSwift`. When you are prompted to "Choose options for adding these files", be sure to check the "Copy items if needed". > 4. Integrated [FMDB](https://github.com/ccgus/fmdb) to your project,FMDB is an Objective-C wrapper around SQLite. > 5. Integrated [Masonry](https://github.com/SnapKit/Masonry) to your project, Masonry is an Objective-C constraint library. There are no specific version requirements, but it is recommended that you use the latest version. > 6. Include LLDebugTool wherever you need it with `import LLDebugToolSwift"`. ## Usage ### Get Started You need to start LLDebugTool at "application:(UIApplication * )application didFinishLaunchingWithOptions:(NSDictionary * )launchOptions", Otherwise you will lose some information. If you want to configure some parameters, must configure before "startWorking". More config details see [LLConfig.h](https://github.com/HDB-Li/LLDebugTool/blob/master/LLDebugTool/Config/LLConfig.h). * `Quick Start` In Objective-C ```Objective-C #import "AppDelegate.h" #import "LLDebug.h" - (BOOL)application:(UIApplication *)application didFinishLaunchingWithOptions:(NSDictionary *)launchOptions { // The default color configuration is green background and white text color. // Start working. [[LLDebugTool sharedTool] startWorking]; // Write your project code here. return YES; } ``` In Swift ```Swift import LLDebugToolSwift func application(_ application: UIApplication, didFinishLaunchingWithOptions launchOptions: [UIApplicationLaunchOptionsKey: Any]?) -> Bool { // ####################### Start LLDebugTool #######################// // Use this line to start working. LLDebugTool.shared().startWorking() // Write your project code here. return true } ``` * `Start With Custom Config` In Objective-C ```Objective-C #import "AppDelegate.h" #import "LLDebug.h" - (BOOL)application:(UIApplication *)application didFinishLaunchingWithOptions:(NSDictionary *)launchOptions { // Start working with config. [[LLDebugTool sharedTool] startWorkingWithConfigBlock:^(LLConfig * _Nonnull config) { //####################### Color Style #######################// // Uncomment one of the following lines to change the color configuration. // config.colorStyle = LLConfigColorStyleSystem; // [config configBackgroundColor:[UIColor orangeColor] primaryColor:[UIColor whiteColor] statusBarStyle:UIStatusBarStyleDefault]; //####################### User Identity #######################// // Use this line to tag user. More config please see "LLConfig.h". config.userIdentity = @"Miss L"; //####################### Window Style #######################// // Uncomment one of the following lines to change the window style. // config.entryWindowStyle = LLConfigEntryWindowStyleNetBar; }]; return YES; } ``` In Swift ```Swift import LLDebugToolSwift func application(_ application: UIApplication, didFinishLaunchingWithOptions launchOptions: [UIApplicationLaunchOptionsKey: Any]?) -> Bool { // Start working with config. LLDebugTool.shared().startWorking { (config) in //####################### Color Style #######################// // Uncomment one of the following lines to change the color configuration. // config.colorStyle = .system // config.configBackgroundColor(.orange, textColor: .white, statusBarStyle: .default) //####################### User Identity #######################// // Use this line to tag user. More config please see "LLConfig.h". config.userIdentity = "Miss L"; //####################### Window Style #######################// // Uncomment one of the following lines to change the window style. // config.windowStyle = .netBar //####################### Features #######################// // Uncomment this line to change the available features. // config.availables = .noneAppInfo } return true } ``` ### Network Request You don't need to do anything, just call the "startWorking" will monitoring most of network requests, including the use of NSURLSession, NSURLConnection and AFNetworking. If you find that you can't be monitored in some cases, please open an issue and tell me. ### Log Print and save a log. More log macros details see [LLDebugToolMacros.h](https://github.com/HDB-Li/LLDebugTool/blob/master/LLDebugTool/DebugTool/LLDebugToolMacros.h). * `Save Log` In Objective-C ```Objective-C #import "LLDebug.h" - (void)testNormalLog {    // Insert an LLog where you want to print. LLog(@"Message you want to save or print."); } ``` In Swift ```Swift import LLDebugToolSwift func testNormalLog() { // Insert an LLog where you want to print. LLog.log(message: "Message you want to save or print.") } ``` * `Save Log with event and level` In Objective-C ```Objective-C #import "LLDebug.h" - (void)testEventErrorLog { // Insert an LLog_Error_Event where you want to print an event and level log.    LLog_Error_Event(@"The event that you want to mark. such as bugA, taskB or processC.",@"Message you want to save or print."); } ``` In Swift ```Swift import LLDebugToolSwift func testEventErrorLog() { // Insert an LLog_Error_Event where you want to print an event and level log. LLog.errorLog(message: "Message you want to save or print.", event: "The event that you want to mark. such as bugA, taskB or processC.") } ``` ### Crash You don't need to do anything, just call the "startWorking" to intercept the crash, store crash information, cause and stack informations, and also store the network requests and log informations at the this time. ### AppInfo LLDebugTool monitors the app's CPU, memory, and FPS. At the same time, you can also quickly check the various information of the app. ### Sandbox LLDebugTool provides a quick way to view and manipulate sandbox, you can easily delete the files/folders inside the sandbox, or you can share files/folders by airdrop elsewhere. As long as apple supports this file format, you can preview the files directly in LLDebugTool. ### Screenshots LLDebugTool provides a screenshot and allows for simple painting and marking that can be easily recorded during testing or while the UI designers debugs the App. ### Hierarchy LLDebugTool provides a view structure tool for viewing or modify elements' properties and information in non-debug mode. ### Magnifier LLDebugTool provides a magnify tool for magnifying local uis and viewing color values at specified pixel. ### Ruler LLDebugTool provides a convenient tools to display touch point information. ### Widget Border LLDebugTool provides a function to display element border, convenient to see the view's frame. ### HTML LLDebugTool can debug HTML pages through `WKWebView`, `UIWebView` or your customized `ViewController` in your app at any time. ### Location LLDebugTool provides a function to mock location at anytime. ### More Usage * You can get more help by looking at the [Wiki](https://github.com/HDB-Li/LLDebugTool/wiki). * You can download and run the [LLDebugToolDemo](https://github.com/HDB-Li/LLDebugTool/archive/master.zip) or [LLDebugToolSwiftDemo](https://github.com/HDB-Li/LLDebugToolSwift/archive/master.zip) to find more use with LLDebugTool. The demo is build under MacOS 10.15.1, XCode 11.2.1, iOS 13.2.2, CocoaPods 1.8.4. If there is any version compatibility problem, please let me know. ## Requirements LLDebugTool works on iOS 8+ and requires ARC to build. It depends on the following Apple frameworks, which should already be included with most Xcode templates: * `UIKit` * `Foundation` * `SystemConfiguration` * `Photos` * `QuickLook` * `CoreTelephony` * `CoreLocation` * `MapKit` ## Architecture * `LLDebug.h` > Public header file. You can refer it to the pch file. * `DebugTool` > `LLDebugTool` Used to start and stop LLDebugTool, you need to look at it. > `LLConfig` Used for the custom color , size , identification and other information. If you want to configure anything, you need to focus on this file. > `LLDebugToolMacros.h` Quick macro definition file. * `Components` - `Network` Used to monitoring network request. - `Log` Used to quick print and save log. - `Crash` Used to collect crash information when an App crashes. - `AppInfo` Use to monitoring app's properties. - `Sandbox` Used to view and operate sandbox files. - `Screenshot` Used to process and display screenshots. - `Hierarchy` Used to process and present the view structure. - `Magnifier` Used for magnifying glass function. - `Ruler` Used to ruler function. - `Widget Border` User to widget border function. - `Function` Used to show functions. - `Html` Used to dynamic test web view. - `Location` Used to mock location. - `Setting` Used to dynamically set configs. ## Communication - If you **need help**, open an issue. - If you'd like to **ask a general question**, open an issue. - If you **found a bug**, _and can provide steps to reliably reproduce it_, open an issue. - If you **have a feature request**, open an issue. - If you **find anything wrong or anything dislike**, open an issue. - If you **have some good ideas or some requests**, send mail(llworkinggroup1992@gmail.com) to me. - If you **want to contribute**, submit a pull request. ## Contact - Send email to [llworkinggroup1992@gmail.com](llworkinggroup1992@gmail.com) - Send message in twitter [@HdbLi](https://twitter.com/HdbLi) - Send message in [JianShu](https://www.jianshu.com/u/a3c82fae85be) ## Change-log A brief summary of each LLDebugTool release can be found in the [CHANGELOG](CHANGELOG.md). ## License This code is distributed under the terms and conditions of the [MIT license](LICENSE).

简介

LLDebugTool是一款针对开发者和测试者的调试工具,它可以帮助你在非Xcode的情况下,进行数据分析和操作。 展开 收起
Objective-C 等 3 种语言
MIT
取消

发行版

暂无发行版

贡献者

全部

近期动态

加载更多
不能加载更多了
Objective-C
1
https://gitee.com/HDB-Li/LLDebugTool.git
git@gitee.com:HDB-Li/LLDebugTool.git
HDB-Li
LLDebugTool
LLDebugTool
master

搜索帮助